
Do Gov Contracts Move Stock Prices?
Do Gov Contracts Influence Stock Prices?
Weekly Federal Contractor Intelligence Report
Running GovClose and Federalytics over the years has required what some would consider an unhealthy obsession with federal spending data. We even built our own internal tools to develop hyper-focused federal sales plans for companies selling business-to-government (B2G).
Selfishly, I wanted to explore a simple question:
Does sustained federal contracting activity show up anywhere in public markets?
Not in headlines.
Not in day-to-day trading.
But structurally — over time.
The Fed200 is a work in progress with hundreds of variables and dependencies. If you’re interested in following how this develops, I invite you to track it with us this year.
What the Fed200 Is (and Isn’t)
TheFed200 Index tracks 207 publicly traded companies with meaningful federal exposure across four market-cap tiers.
Each week, we look at:
Historic federal contracting data(FY2022–FY2026)
Daily contract appearances(with known reporting lag)
Daily stock prices
Index-level performance compared to the S&P 500
This is not investment advice and it does not claim causation.
It’s a transparency tool designed to surface patterns — or the absence of them — over time.
Fed200 Index Performance vs. S&P 500
Period analyzed:January 2 → January 9, 2026 (most recent complete week)
Below are the actual index-level results from the Fed200 dashboard:
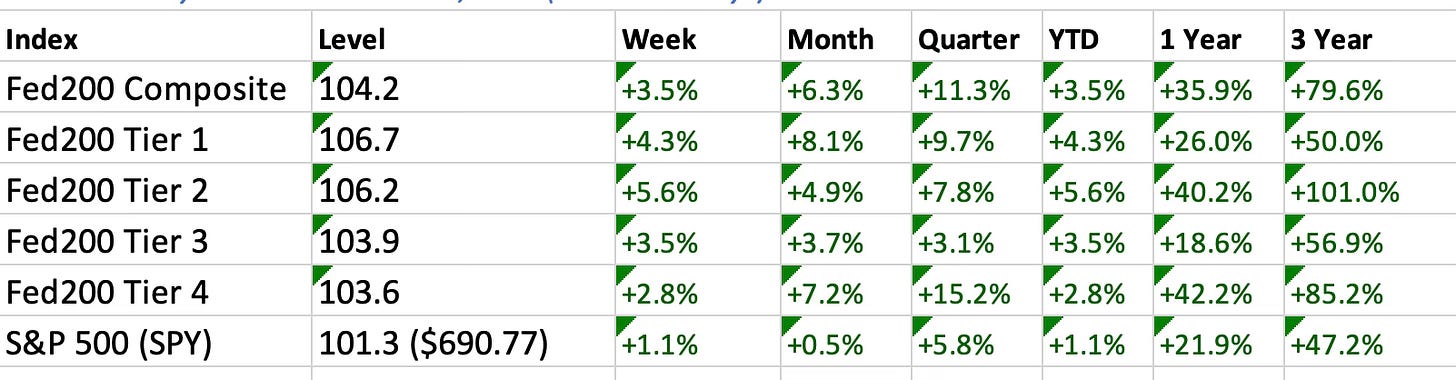
What this shows (without over-interpreting):
The Fed200 Composite outperformed the S&P 500 acrossevery timeframe shownthis week.
Tier 2 led the week(+5.6%), whileTier 4 led the quarter(+15.2%).
Tier performance varies — which is exactly why the index is segmented this way.
This is the scoreboard. Interpretation comes later.
Winners and Losers by Tier
People intuitively understand winners and losers. This section shows how individual companies performedwithin each tierduring the week.
Returns reflect Jan 02 → Jan 09, 2026. Descriptive only.
Tier 1 (≥ $25B Market Cap)
Top Performers
Huntington Ingalls (HII):+10.0%
BAE Systems ADR (BAESY):+9.1%
CACI International (CACI):+8.6%
Bottom Performers
CVS Health (CVS):−6.2%
Boeing (BA):−4.8%
IBM (IBM):−3.9%
Tier 2 ($1B–$25B Market Cap)
Top Performers
AeroVironment (AVAV):+36.2%
Kratos Defense (KTOS):+32.6%
Elbit Systems (ESLT):+13.2%
Bottom Performers
Maxar Technologies (MAXR):−9.4%
SAIC (SAIC):−6.1%
Leidos Holdings (LDOS):−4.7%
Tier 3 ($100M–$1B Market Cap)
Top Performers
United Rentals (URI):+11.1%
Oceaneering International (OII):+10.7%
Mercury Systems (MRCY):+9.3%
Bottom Performers
Parsons Corp (PSN):−8.2%
Cohu (COHU):−6.5%
Astronics (ATRO):−5.9%
Tier 4 (< $100M Market Cap)
Top Performers
Rouchon Industries (RCHN):+344.4%
Track Group (TRCK):+42.7%
Sonendo (SONX):+31.4%
Bottom Performers
Guardion Health (GHSI):−22.1%
Creative Realities (CREX):−18.6%
Allied Corp (ALID):−15.9%
Note: Tier 4 movements tend to be extreme due to lower liquidity and smaller market capitalization.
Company Highlights
Each week, we’ll highlight one or two companies to show howstock performance and federal contracting activity can coexist— without implying cause, prediction, or recommendation.
L3Harris Technologies (LHX)
Stock Performance
Weekly:+8.2%
Month-to-Date:+15.2%
Year-to-Date:+8.2%
Federal Contracting Snapshot
Contract actions this week:11
FY2026 obligations (to date):$316.8M
FY2025 obligations:$6.45B
FY2024 obligations:$9.15B
CACI International (CACI)
Stock Performance
Weekly:+8.6%
Month-to-Date:−2.2%
Year-to-Date:+8.6%
Federal Contracting Snapshot
Contract actions this week:8
FY2026 obligations (to date):$20.8M
FY2025 obligations:$3.89B
FY2024 obligations:$4.57B
These highlights are meant toground the index in real data, not to explain short-term market behavior or draw causal conclusions.
What Comes Next
As weekly history builds, we’ll begin testing:
Whether contract activity shows up withlagged effects
Whether certain tiers behave differently over time
Whetherpersistencematters more than growth
If patterns exist, we’ll surface them.
If they don’t, that’s valuable too.
About the Author
Rick Howardis a retired U.S. Air Force Lieutenant Colonel and former federal acquisitions officer who managed over$82 billionin government contracts during his military career. After retiring from active duty, he foundedGovClose, a government contracting education and certification company focused on helping professionals and businesses understand how federal markets actually work.
Data Quality Statement
While we strive for accuracy, errors may occur in: - UEI-to-ticker mapping - Contract classification - Fiscal year assignment - Stock price data retrieval
Users should verify critical information with primary sources (SAM.gov, SEC filings, company investor relations) before making business or investment decisions.
About GovClose
GovClosespecializes exclusively in government contracting education and market intelligence. Our services include:
Professional Development:- Government contracting certification programs - Federal sales fundamentals training - Compliance and regulatory education - Business development strategy workshops
Market Intelligence:- Weekly federal spending analysis (Federalytics) - Contract award tracking and alerts - Agency procurement pattern analysis - Competitive landscape research
Consulting Services:- Federal business development strategy - Proposal development and review - Contract compliance guidance - GWAC/IDIQ vehicle selection
Why GovClose:Unlike generalist business consulting, GovClose focuses exclusively on the federal market. Our team’s acquisition experience provides practical, operations-based guidance rather than theoretical frameworks.
Learn More:- Website: govclose.com - Newsletter: federalytics.substack.com - YouTube: youtube.com/@dodcontractacademy - Contact: [email protected]
Reader Engagement
Questions About the Fed200?Reply to this email or contact [email protected]. We welcome feedback on methodology, data coverage, and analysis approach.
Data Requests:Interested in specific company deep dives or sector analysis? Let us know which areas you’d like explored in future reports.
Corrections:If you identify data errors or methodology concerns, please notify us. We maintain commitment to accuracy and will issue corrections as needed.
Professional Development:Visit govclose.com to explore government contracting certification programs and access additional federal market resources.
Next Week’s Focus:We’ll examine whether January contract activity patterns continue into February, analyze any emerging trends in specific procurement categories, and provide updated stock-contract correlation analysis as our weekly dataset expands.
Subscribe:Ensure you receive next week’s Fed200 report and ongoing federal market intelligence by subscribing to Federalytics.
Data Sources: SAM.gov contract awards database, Yahoo Finance market data, publicly available SEC filings. Analysis conducted by GovClose. Stock prices current as of January 7, 2026 market close. Contract data reflects awards through January 10, 2026 with typical 1-2 month reporting lag from award execution.
The Fed200 Index is a proprietary analytical framework developed by GovClose. Views expressed represent the analysis of Rick Howard and GovClose team and should not be construed as investment recommendations.
Report Published: January 10, 2026 | Inaugural Edition