
Fed200 - Government Contract Stock Report
Report Generated: Saturday, January 24, 2026
Analysis Period: January 16-23, 2026 (6 trading days)
This Week’s Performance
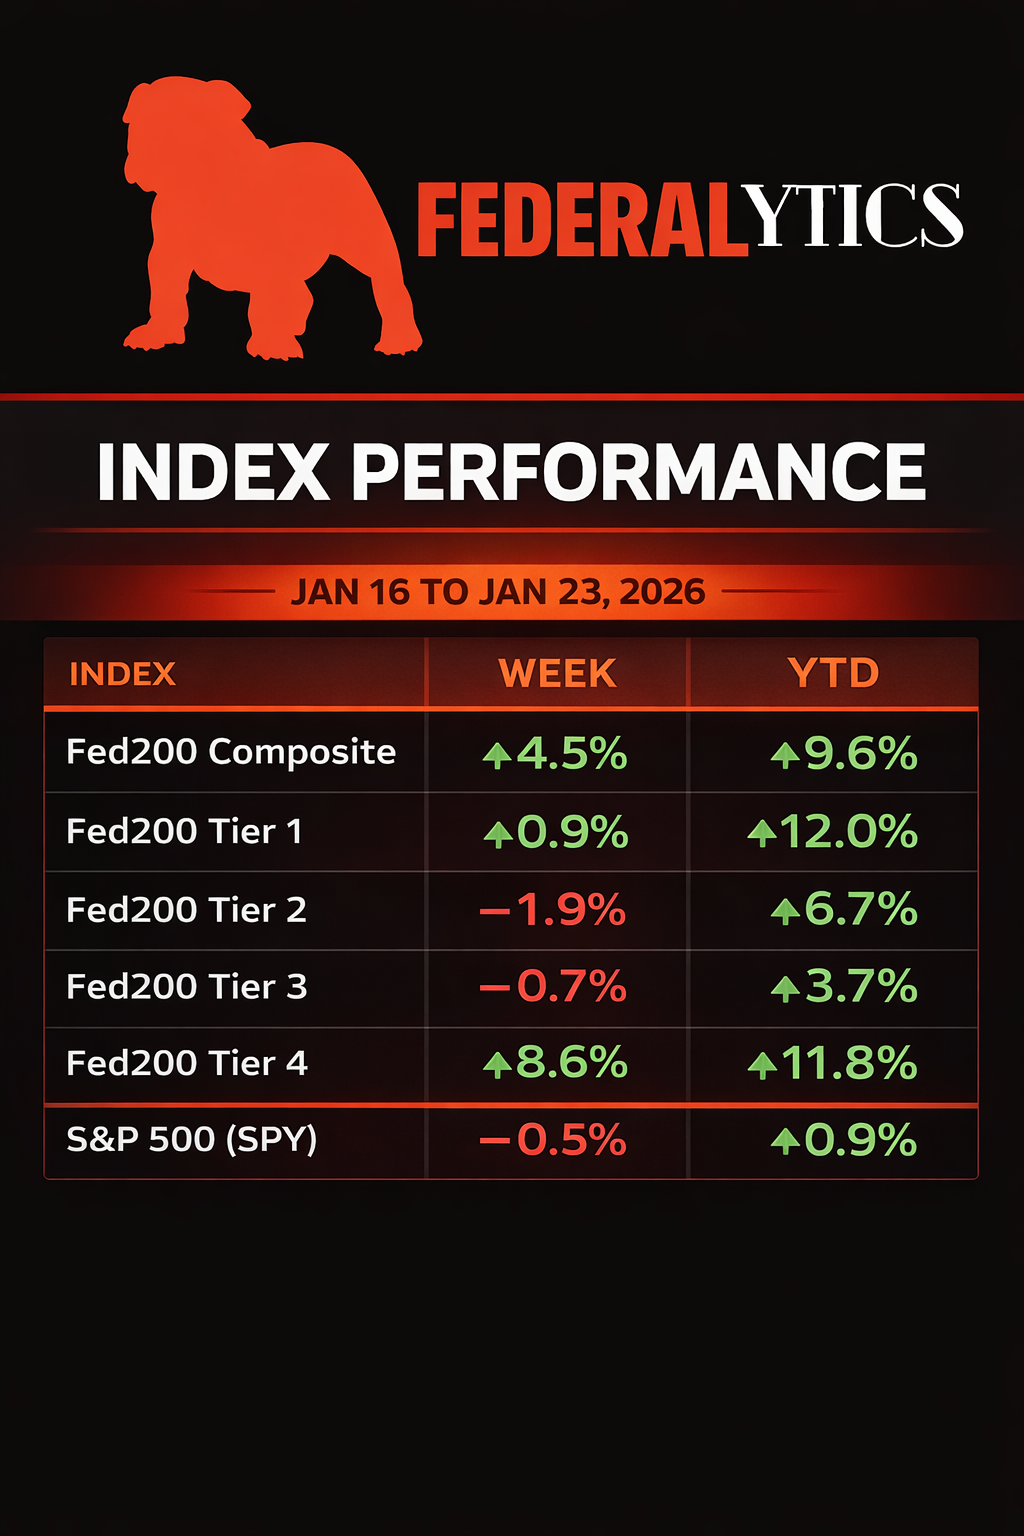
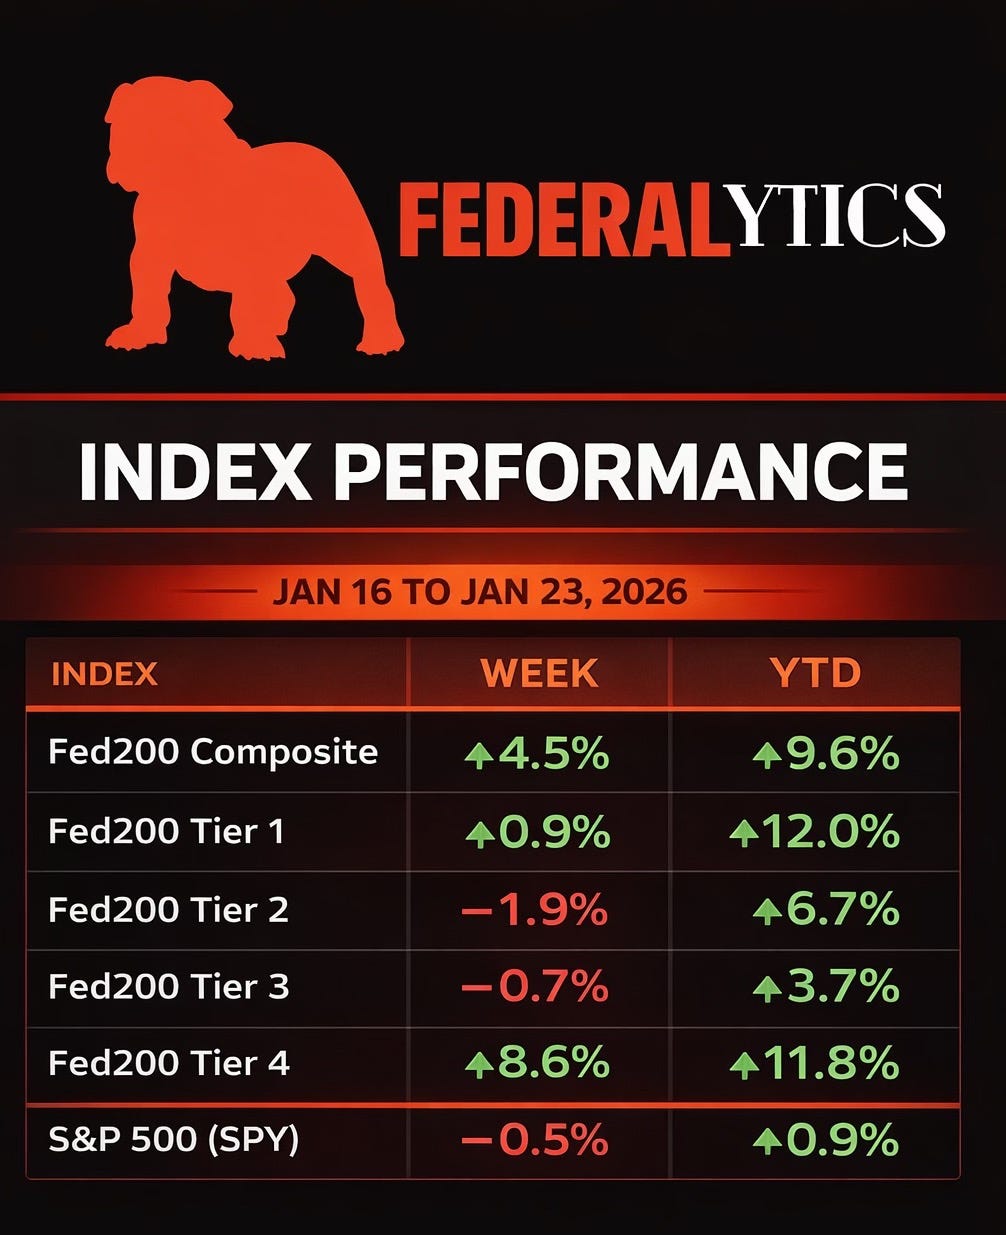
The Fed200 Composite advanced +4.5% this week while the S&P 500 declined -0.5%, marking 500 basis points of outperformance.
This doesn’t prove a pattern, but continues the thesis we’re testing: federal contractors as a sector may deliver structural alpha independent of weekly contract announcements. The 3-year track record (+81.4% vs S&P’s +45.0%) suggests there’s something here worth investigating systematically.
What Is the Fed200?
We’ve been tracking 207 publicly traded companies with meaningful federal contracting exposure, segmented into four tiers based on government contract revenue (not market capitalization).
This is Week 3 of our tracking initiative.
Each week, we analyze:
Historic federal contracting data (FY2022–FY2026)
Daily contract appearances (with known 1-2 month reporting lag)
Daily stock prices across all 207 companies
Index-level performance compared to the S&P 500
What this is: A transparency tool designed to surface patterns — or the absence of them — over time. We’re building systematic data to understand how federal contractor stocks actually behave.
What this isn’t: Investment advice. We don’t claim causation between contracts and stock prices. We’re in the testing phase, refining methodology and validating hypotheses.
Progress: 3 weeks of tracking complete. Early patterns are emerging - some expected, some surprising. Here’s what we’re learning and what we’re testing next.
Performance Summary (Jan 16-23, 2026)
Fed200 Composite Index:
Week: +4.5%
Month: +12.2%
Quarter: +12.4%
Year-to-Date: +9.6%
1 Year: +37.8%
3 Year: +81.4%
S&P 500 (SPY):
Week: -0.5%
Month: -0.2%
Quarter: +1.8%
Year-to-Date: +0.9%
1 Year: +16.0%
3 Year: +45.0%
Outperformance: +500 basis points this week, +3,640 basis points over 3 years
The 3-year outperformance (+81.4% vs +45.0%) represents the structural pattern we’re validating through weekly tracking. Short-term volatility is expected - long-term sector advantage is the hypothesis we’re testing.
Tier Performance
The Fed200 segments companies into four tiers based on government contract revenue (not market cap), allowing us to track how different contractor sizes behave:
Tier 1 (≥$25B contract revenue) - 12 stocks:
Week: +0.9% | Daily: +0.0% | YTD: +12.0%
Volatility: 7.3% | Win Rate: 92% of stocks positive
Examples: Lockheed Martin, Northrop Grumman, L3Harris, CACI
Tier 2 ($1B-$25B contract revenue) - 27 stocks:
Week: -1.9% | Daily: -0.9% | YTD: +6.7%
Volatility: 11.0% | Win Rate: 78% of stocks positive
Examples: Teledyne, Kratos Defense, AeroVironment, Parsons
Tier 3 ($100M-$1B contract revenue) - 42 stocks:
Week: -0.7% | Daily: -0.5% | YTD: +3.7%
Volatility: 8.8% | Win Rate: 71% of stocks positive
Examples: Oceaneering, WidePoint, Booz Allen Hamilton
Tier 4 (<$100M contract revenue) - 115 stocks:
Week: +8.6% | Daily: +7.6% | YTD: +11.8%
Volatility: 74.0% | Win Rate: 53% of stocks positive
Smaller contractors with high volatility and dispersion
Initial observation: Tier 4 led weekly returns but shows extreme volatility (74% standard deviation) with barely half of stocks positive. Tier 1 lagged on weekly returns but delivered the best risk-adjusted performance (12.0% YTD with only 7.3% volatility).
Testing ahead: Is this tier inversion (small outperforming large) a persistent pattern or weekly noise? We’re tracking this over the next quarter to determine optimal tier allocation strategy.
Contract Activity
Federal agencies awarded 3,454 contract actions during the week (to the companies we’re tracking in total, the federal government awarded a lot more than that!) , down 24% from the prior period. Total obligations: $55.6M. Only 45 of 207 Fed200 companies (22%) registered any contract activity.
Over the next three months, we’re refining portfolio composition - testing whether a concentrated basket of 60-80 consistent contract winners delivers better risk-adjusted returns than our current 207-company approach.
Top 10 Most Active Contractors
By number of contract actions this week:
W.W. Grainger (GWW) - 2,584 actions | $16.0M FY2026 YTD
MSC Industrial (MSM) - 668 actions | $4.9M FY2026 YTD
McKesson (MCK) - 38 actions | $1,242.7M FY2026 YTD
AT&T (T) - 21 actions | $216.7M FY2026 YTD
General Dynamics IT (GD) - 15 actions | $171.6M FY2026 YTD
Quest Diagnostics (DGX) - 14 actions | $49.6M FY2026 YTD
Ecolab (ECL) - 13 actions | $1.0M FY2026 YTD
Verizon (VZ) - 11 actions | $65.3M FY2026 YTD
Cardinal Health (CAH) - 8 actions | $22.5M FY2026 YTD
Abbott Laboratories (ABT) - 7 actions | $55.6M FY2026 YTD
Top 10 Largest Contract Awards
By obligation amount:
General Dynamics IT (GD) - $18.0M - GSA FEDSIM delivery order
CACI International (CACI) - $12.7M - GSA delivery order
Huntington Ingalls (HII) - $8.0M - GSA delivery order
CACI International (CACI) - $3.8M - NASA definitive contract
Lockheed Martin (LMT) - $2.2M - DHS delivery order
AT&T (T) - $1.5M - DOT BPA call
Pfizer (PFE) - $1.2M - HHS IDC
CACI International (CACI) - $1.0M - GSA delivery order
Verizon (VZ) - $1.0M - DOT BPA call
Cardinal Health (CAH) - $950K - VA delivery order
Note: CACI appeared three times in the top 10 ($16.7M total). Their stock gained 4.7% this week - one of the rare instances where contract activity and stock performance aligned in the same week.
Agency Breakdown
Civilian dominance: 3,446 actions (99.8%) compared to just 8 DOD actions (0.2%)
Top 5 agencies by action count:
General Services Administration: 3,282 actions (95.0%)-
Department of Justice: 82 actions (2.4%)
Department of Veterans Affairs: 25 actions (0.7%)
Department of Homeland Security: 18 actions (0.5%)
NASA: 12 actions (0.3%)
Note: GSA assists other agencies in their government contracting purchases, acting more like a “middle man”. BLUF: although GSA may be the contracting agency, the funding almost certainly comes from other federal agencies.
DOW absence: Defense War activity was statistically zero this week. This is likely reporting lag rather than actual procurement patterns - we’ll track whether this affects returns.
What the Data Is Teaching Us
The Correlation Finding: Markets Are Efficient
Week 3 measured a 0.009 correlation between contract awards and stock returns - essentially random.
This validates what we proved through prior research: our analysis of 169,541 stock price observations across 17,859 contract events showed individual announcements averaging -0.026% returns. Markets price contract news within hours of SAM.gov publication.
Why this matters: This proves our edge isn’t in timing contract announcements (everyone sees them simultaneously). Our edge is in portfolio construction - identifying which companies consistently win contracts and holding them as a basket to capture sector alpha.
Testing next: Do contract trends (measured quarterly) predict returns better than individual events (measured weekly)? We’re building the dataset to test this hypothesis over the next 3-6 months.
The Persistence Collapse: No Consistent Winners
Week 3 revealed something unexpected: zero companies scored above 60 on our persistence threshold.
This metric tracks companies consistently appearing in the top or bottom quartile over rolling 13-week windows:
+10 points per week in top quartile
-5 points per week in bottom quartile
Scale: 0-100
What changed from Week 1: Complete rotation. Companies that led last week didn’t lead this week. No stock maintained top-quartile performance consistently.
What this suggests: Federal contractor stock returns may be more episodic than stable. Weekly and monthly volatility is high across all tiers. This is forcing us to rethink our persistence metrics.
Testing ahead: We’re investigating whether contract-based persistence (who consistently wins work over quarters) correlates better with returns than price-based persistence (who has recent hot stocks). Initial hypothesis: the former may be a better predictor than the latter.
The Tier Inversion: Small Beat Large This Week
Tier 4 (micro-caps <$100M) gained 8.6% while Tier 1 (mega-caps ≥$25B) gained just 0.9% - an unusual pattern worth tracking.
But look closer at the risk:
Tier 4: 8.6% return, 74% volatility, 53% win rate
Tier 1: 0.9% return, 7.3% volatility, 92% win rate
Tier 1 delivered superior risk-adjusted returns despite lower absolute performance. Tier 4’s extreme volatility means half the companies are losing even when the tier averages up.
Testing next quarter: Is tier inversion persistent or random? Which tier allocation strategy works over years, not weeks? We’re testing multiple approaches: conservative (60% Tier 1), moderate (45% Tier 1), and aggressive (30% Tier 1).
Company Spotlights
Tier 1 Leader: CACI International (CACI)
Stock Performance:
Weekly: +4.7%
Month-to-Date: +21.6%
Year-to-Date: +23.2%
Contract Activity (This Week):
5 contract actions
Appeared 3 times in top-10 largest awards
Total value: $16.7M ($12.7M + $3.8M + $1.0M)
CACI is one of the rare cases where contract activity and stock performance aligned in the same week. The company tracks 39 UEIs (parent + 38 subsidiaries), giving us comprehensive visibility into their total federal footprint.
Tier 2 Leader: Teledyne Technologies (TDY)
Stock Performance:
Weekly: +6.4%
Month-to-Date: +19.8%
Year-to-Date: +19.8%
Contract Activity (This Week):
0 contract actions
0 obligations
Stock advanced without any new contract activity visible in our tracking window - a perfect example of why weekly correlation is zero. Markets are pricing forward expectations, not historical announcements. Teledyne tracks 33 UEIs, so we capture comprehensive contract flow when it occurs.
Tier 3 Leader: Oceaneering International (OII)
Stock Performance:
Weekly: +7.4%
Month-to-Date: +14.4%
Year-to-Date: +14.4%
Contract Activity (This Week):
0 contract actions
0 obligations
Another week where stock performance was disconnected from contract announcements. This validates our research showing that individual events don’t drive weekly returns.
Weekly Movers by Tier
Tier 1 (≥$25B)
Top 3 Performers:
CACI: +4.7% (5 contracts)
L3Harris (LHX): +4.5% (3 contracts)
Boeing (BA): +2.9% (4 contracts)
Bottom 3 Performers:
McKesson (MCK): -2.4% (38 contracts - most active, worst performer)
Raytheon (RTX): -2.2% (1 contract)
Huntington Ingalls (HII): -1.3% (1 contract, including $8M award)
McKesson’s negative correlation is instructive - highest contract volume (38 actions) but worst performance. Demonstrates the lag effect: contract wins don’t immediately translate to share price gains.
Tier 2 ($1B-$25B)
Top 3 Performers:
Teledyne (TDY): +6.4% (0 contracts)
Tyson Foods (TSN): +3.0% (0 contracts)
DaVita (DVA): +2.5% (0 contracts)
Bottom 3 Performers:
AeroVironment (AVAV): -20.9% (0 contracts) - reversed from Week 1’s +36.2%
Kratos Defense (KTOS): -13.9% (1 contract)
Abbott Labs (ABT): -12.2% (7 contracts, led tier in activity)
Pattern: All weekly winners ran without contract activity - pure market momentum. Meanwhile Abbott dropped despite leading contract activity. Clear evidence that weekly contract data is lagging, not leading.
Tier 3 ($100M-$1B)
Top 3 Performers:
Oceaneering (OII): +7.4% (0 contracts)
WidePoint (WYY): +6.4% (0 contracts)
Avanos Medical (AVNS): +6.2% (0 contracts)
Bottom 3 Performers:
Xerox (XRX): -13.8% (0 contracts)
Ameriguard Security (AGSS): incomplete price data
Forge Group (FIGP): incomplete price data
Methodology Note: Subsidiary Tracking
The Fed200 tracks 207 publicly-traded parent companies through 1,575 unique entity identifiers (UEIs) - a 7.6x coverage ratio.
Why this matters: Many government contractors operate through multiple legal entities. Lockheed Martin wins contracts under its parent UEI and through operating divisions (Aeronautics, Space, Missiles & Fire Control, etc.). Standard tracking misses 80%+ of actual contract flow.
Examples from our data:
CACI: 1 ticker → 39 UEIs
Teledyne: 1 ticker → 33 UEIs
L3Harris: 1 ticker → ~30 UEIs
We map all subsidiary awards back to parent tickers, ensuring complete visibility. This remains a genuine methodological advantage - most contract tracking tools only monitor parent company UEIs.
Testing ahead: Do companies with extensive subsidiary structures perform differently? Does comprehensive UEI tracking actually improve return prediction, or does it just add noise? We’re analyzing this over the next quarter.
What We’re Testing Over the Next 3 Months
The Fed200 is in active development. Week 3 validated some hypotheses and raised new questions. Here’s our testing roadmap:
Portfolio Composition Refinement
Question: Do all 207 companies belong in the Fed200?
Evidence: Only 22% showed contract activity this week. Tier 4 has extreme volatility (74%) with barely half of stocks positive.
Testing: Concentrated portfolio (60-80 top performers) vs. broad basket (207 companies). Which delivers better risk-adjusted returns?
Timeline: Analysis in Month 3, potential composition changes in Quarter 2.
Tier Allocation Strategy
Question: What’s the optimal weighting across tiers?
Evidence: Tier 1 shows best risk-adjusted returns (1.64 Sharpe-like ratio). Tier 4 shows high absolute returns but extreme volatility.
Testing: Conservative (60/30/10/0), Moderate (45/30/20/5), Aggressive (30/30/25/15) allocations.
Timeline: Quarterly performance comparison, recommendations by Month 4.
Contract Metrics That Matter
Question: Which contract signals actually predict returns?
Evidence: Weekly events show zero correlation (0.009). But sector outperforms over years (+81.4% vs +45.0% on 3-year horizon).
Testing: Contract trends (quarterly growth), persistence (consistent winners over 13+ weeks), agency mix, contract types, new vs. renewal awards.
Timeline: Building dataset now, initial analysis in Month 3-4.
Sector Sub-Segment Analysis
Question: Should we break the Fed200 into specialized indices?
Evidence: Defense tech, healthcare IT, professional services, and industrial distributors show different characteristics.
Testing: Sub-sector performance patterns, whether specialized indices outperform broad basket.
Timeline: Initial segmentation analysis in Month 2-3.
Rebalancing Frequency
Question: How often should portfolio composition change?
Evidence: Zero companies showed price persistence over 13 weeks. High rotation.
Testing: Quarterly vs. annual rebalancing, contract-triggered vs. calendar-driven.
Timeline: Backtest different approaches once we have 6+ months of data.
Data Quality Notes
Analysis Period: January 15-23, 2026 (6 trading days, 9 calendar days)
Stock Data: Market close January 23, 2026
Contract Data: SAM.gov through January 24, 2026 (with typical 1-2 month reporting lag from award execution to publication)
Coverage: 207 tickers tracking 1,575 UEIs (7.6x ratio)
Data Quality Alert: 4 missing price data days in the last 30 days for select tickers (primarily Tier 3-4 micro-caps with thin trading volume)
Methodology: Equal-weighted index within tiers. Tiers based on government contract revenue, not market capitalization.
Important Disclaimers
Testing Phase Notice: The Fed200 is in active development. We’re building this tracking system transparently, sharing both successes and failures as we refine our methodology. These reports document the testing process, not final conclusions. Portfolio composition, tier definitions, and methodology may change based on evidence.
Not Investment Advice: This analysis is for informational and educational purposes only. It does not constitute investment advice, recommendations to buy or sell securities, or financial planning guidance. We’re tracking patterns and testing hypotheses, not recommending positions.
Data Limitations:
Contract data has a 1-2 month reporting lag between award execution and SAM.gov publication
Stock prices are point-in-time and don’t account for all corporate actions
UEI-to-ticker mapping, contract classification, and fiscal year assignments may contain errors
Users should verify critical information with primary sources (SAM.gov, SEC filings, company investor relations)
No Performance Guarantees: Past performance does not guarantee future results. The correlation analysis describes historical relationships and should not be interpreted as predictive. Market conditions, government spending patterns, and individual company circumstances change.
What’s Next
Week 4 will add another data point to test whether early patterns persist. But the real work happens over the next quarter as we refine portfolio composition - determining which companies truly belong in the Fed200, testing optimal tier allocations, and validating which contract metrics actually correlate with returns.
We’re building this transparently. If you have questions about methodology, suggestions for refinement, or patterns you’d like us to investigate, respond to this email.
The Fed200 isn’t finished - it’s a living research project. And that’s the point.
About the Author
Rick Howard is a retired U.S. Air Force Lieutenant Colonel and former federal acquisitions officer who managed over $82 billion in government contracts during his military career. After retiring from active duty, he founded GovClose, a government contracting education and certification company. The Fed200 is a research initiative combining his acquisitions expertise with systematic tracking of publicly-traded federal contractors.
About GovClose
GovClose specializes exclusively in government contracting education and market intelligence:
Professional Development:
Government contracting certification programs
Federal sales fundamentals training
Compliance and regulatory education
Business development strategy workshops
Market Intelligence:
Weekly federal spending analysis (Federalytics newsletter)
Contract award tracking and analysis
Agency procurement pattern research
Fed200 tracking reports (experimental)
Consulting Services:
Federal business development strategy
Proposal development and review
Contract compliance guidance
GWAC/IDIQ vehicle selection
Learn More:
Website: govclose.com
Newsletter: federalytics.substack.com
YouTube: @dodcontractacademy
Contact: [email protected]
Next Report: Week 3 analysis will be published Saturday, January 31, 2026, covering the trading period January 24-30, 2026.
Subscribe to ensure you receive weekly Fed200 reports and ongoing federal market intelligence.
The Fed200 Index is a proprietary analytical framework developed by GovClose. Analysis and views expressed represent the research of Rick Howard and the GovClose team. Information provided is for educational purposes and should not be construed as investment recommendations. Contract data sourced from SAM.gov. Stock price data sourced from public markets via Yahoo Finance.
Report Published: January 26, 2026 | Week 3 Edition
Ready to go pro?
The GovClose Professional Training Program is built for people ready to commit to learning a new skill set, implementing that skill set, and working with a community of professionals who are serious about winning in the federal market.
If you think you have what it takes, set up an enrollment interview with the GovClose advisory team.