
Government Contracts & Stock Prices
Federal agencies awarded 3,227 contract actions to Fed200 companies during the analysis period (Jan 24 - Feb 1, 2026), up 59.5% from the prior weeks's 2,023 actions.
Total obligations to Fed200 companies: $1.81 billion
This Week’s Performance
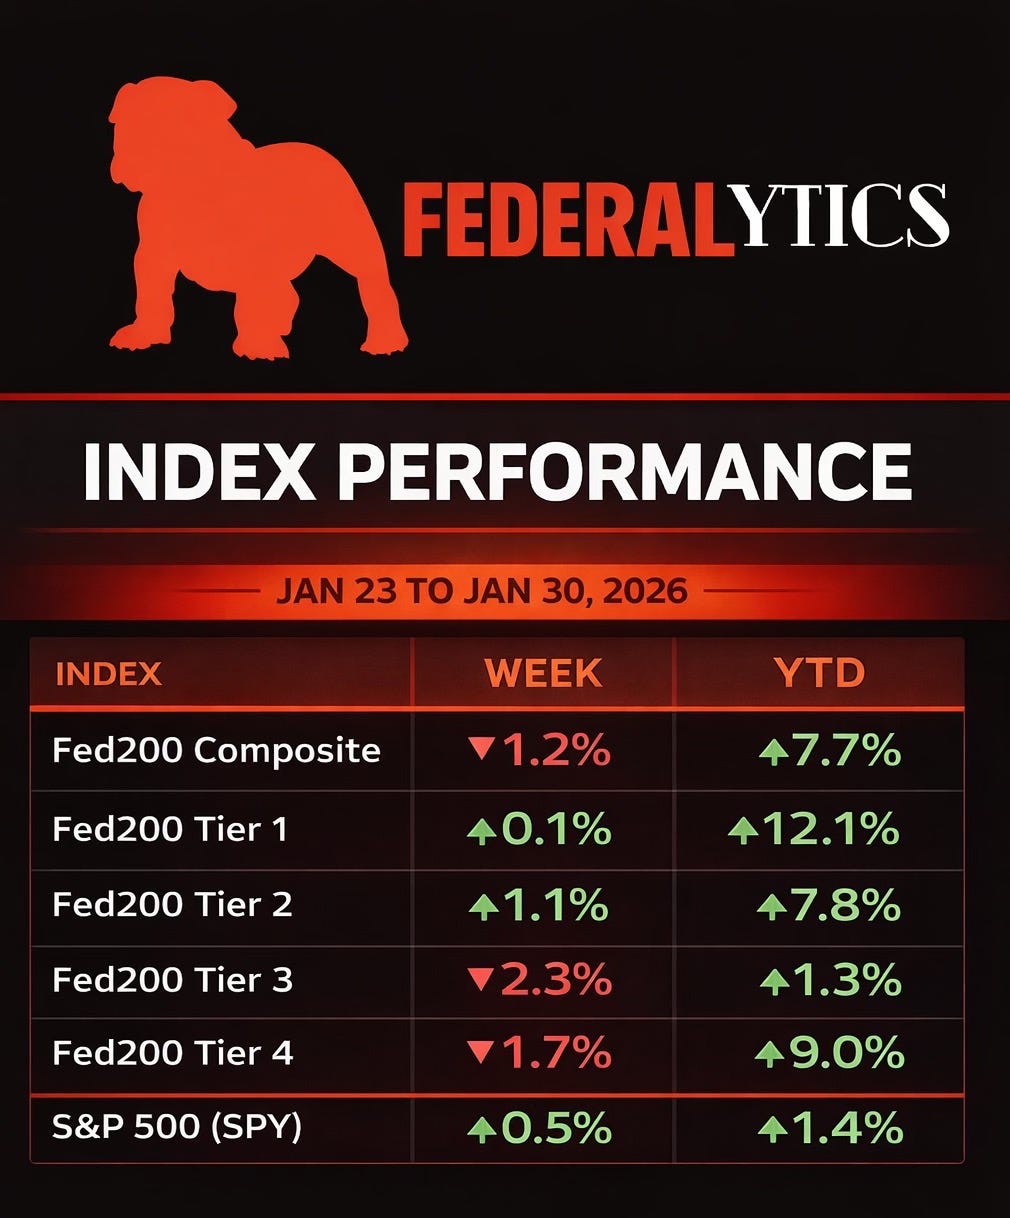
Fed200 Composite: -1.2%
S&P 500: +0.5%
The Fed200 underperformed the S&P 500 by 1.7 percentage points this week - our first weekly decline after three consecutive weeks of gains.
What Is the Fed200?
We’re tracking 207 publicly traded companies with meaningful federal contracting exposure. Under these 207 tickers are1,575 child entities selling to the US federal government which we’ve mapped to their parent companies.
The parent entities are segmented into four tiers based on total government contract volume.
Each week, we analyze:
Historic federal contracting data (FY2022-FY2026)
Daily contract appearances (with known 1-2 month reporting lag)
Daily stock prices across all 207 companies
Index-level performance compared to the S&P 500
What this is: A transparency tool designed to surface patterns - or the absence of them - over time.
What this isn’t: Investment advice. We don’t claim causation between contracts and stock prices. We’re in the testing phase, refining methodology and validating hypotheses.
Tier Performance
The Fed200 segments companies into four tiers based on total government contract revenue, allowing us to track how companies with different levels of federal exposure behave:
Tier 1 (≥$25B in gov contract revenue) - 12 stocks
Week: +0.1% | YTD: +12.1% | 3-Year: +56.7%
Examples: Lockheed Martin, Northrop Grumman, L3Harris, Raytheon
Tier 1 led YTD performance (+12.1%) while showing the lowest weekly volatility. These companies with the highest government contract volumes barely moved this week (+0.1%), demonstrating characteristic stability. When you’re the incumbent on major defense programs, weekly swings are rare.
Top Performer: LMT (Lockheed Martin) +6.8% this week with 71 contract actions
Tier 2 ($1B-$25B in gov contract revenue) - 27 stocks
Week: +1.1% | YTD: +7.8% | 3-Year: +107.3%
Examples: Arrow Electronics, Cardinal Health, Teledyne, Kratos Defense
Tier 2 was the only tier with positive weekly performance (+1.1%), showing defensive characteristics when the composite dropped. Over 3 years, Tier 2 has delivered +107.3% returns vs SPY’s +48.1% - the highest of any tier. These companies have substantial federal contracting activity but aren’t the mega-cap incumbents.
Top Performer: ARW (Arrow Electronics) +12.9% this week
Tier 3 ($100M-$1B in gov contract revenue) - 42 stocks
Week: -2.3% | YTD: +1.3% | 3-Year: +53.6%
Examples: State Street, Oceaneering, WidePoint, Mercury Systems
Tier 3 lagged this week (-2.3%) and shows the weakest YTD performance (+1.3%). This is the tier where companies have meaningful but not dominant federal exposure.
Top Performer: STT (State Street) +4.4% this week
Tier 4 (<$100M in gov contract revenue) - 126 stocks
Week: -1.7% | YTD: +9.0% | 3-Year: +73.9%
Smaller contractors with high volatility and dispersion. Tier 4 swings wildly week-to-week but shows strong long-term gains. This is where individual stock selection matters most - half the companies can be down while the tier average is up.
What the Data Is Teaching Us
Week-to-Week vs. Long-Term Patterns
Week 4 demonstrates exactly why we track systematically rather than reacting to weekly moves:
This Week:
Fed200: -1.2%
SPY: +0.5%
Year-to-Date:
Fed200: +7.7%
SPY: +1.4%
3-Year:
Fed200: +73.7%
SPY: +48.1%
Tier 2’s Long-Term Outperformance
The tier data reveals an interesting pattern:
YTD Performance:
Tier 1: +12.1% (highest)
Tier 2: +7.8%
1-Year Performance:
Tier 1: +33.3
Tier 2: +37.6
3-Year Performance:
Tier 1: +56.7%
Tier 2: +107.3% (highest)
Tier 2 has nearly doubled Tier 1’s 3-year returns. These are companies with $1B-$25B in government contract revenue - substantial federal exposure but not the mega-cap defense primes. Large enough to win major contracts, but small enough that contract wins can materially impact the stock.
This is why we’re testing whether Tier 2 delivers better risk-adjusted returns than Tier 1 over extended periods.
Contract Activity
Federal agencies awarded 3,227 contract actions to Fed200 companies during the analysis period (Jan 24 - Feb 1, 2026), up 59.5% from the prior period’s 2,023 actions.
Total obligations to Fed200 companies: $1.81 billion
Contract Size Distribution:
Mega contracts (>$10M): 21 contracts worth $1.66B (92% of total value)
Large contracts ($1M-$10M): 41 contracts worth $126.5M (7% of value)
Small contracts (<$1M): 3,165 contracts worth $30.8M (1% of value)
This distribution is consistent across weeks: a small number of large contracts account for the vast majority of dollars, while thousands of micro-purchases drive action count.
Top 10 Contracts This Week (by dollar value)
The largest contracts awarded to Fed200 companies:
HII (Huntington Ingalls) - $525M contract
HII (Huntington Ingalls) - $484M contract
KBGPF (Kongsberg Defence & Aerospace) - $183M contract
HON (Honeywell)
BA (Boeing)
NOC (Northrop Grumman)
LMT (Lockheed Martin)
RTX (Raytheon)
LHX (L3Harris)
CACI (CACI International)
Huntington Ingalls dominated contract value this week with over $1 billion in awards across two major contracts. This is typical defense shipbuilding - infrequent but massive contract actions.
Most Active Contractors (by action count)
Companies with the most contract actions this week:
W.W. Grainger (GWW): 1,600 actions
Cardinal Health (CAH): 626 actions
MSC Industrial (MSM): 473 actions
Lockheed Martin (LMT): 71 actions
AT&T (T): 63 actions
Boeing (BA): 51 actions
General Dynamics IT (GD): 28 actions
Raytheon (RTX): 28 actions
McKesson (MCK): 25 actions
Northrop Grumman (NOC): 24 actions
The Pattern We’re Tracking
Contract volume doesn’t equal contract sensitivity.
Grainger: 1,600 actions (mostly micro-purchases under $1,000 each)
HII: 2 actions worth over $1 billion total
Which matters more for stock performance? That’s what we’re testing over quarters, not weeks.
The SAM.gov database has a 1-2 month reporting lag from contract execution to publication. This means weekly contract data is backward-looking. Markets price forward expectations, not historical announcements. We track contract patterns to understand company behavior, not to trade on individual announcements.
Company Spotlights
Tier 1 Leader: Lockheed Martin (LMT)
Week: +6.8% | YTD: +12.1%
Contract Activity: 71 actions this week (up from 2 in prior period)
LMT’s 6.8% gain this week coincided with a surge in contract activity - a rare instance where contract flow and stock performance aligned in the same week. This is the exception, not the rule. Most weeks, contract announcements don’t drive immediate stock moves.
Also, and this is worth foot-stomping again and again, I am not taking any of the typical news or data investors normally review into this equation. Any correlation between government contracts and stock price going up or down could be purely coincidence or have other factors involved that we’re not including.
This is going to start reading like a newsletter of disclaimers, but it is also worth noting that there is a lag between when a government contract is awarded vs when it appears in the public data set (which I get via sam.gov and usaspending.gov).
Tier 2 Leader: Arrow Electronics (ARW)
Week: +12.9% | YTD: +7.8%
Contract Activity: 1 action this week
ARW jumped 12.9% despite minimal contract activity, demonstrating that weekly contract data lags market movement. Markets price forward expectations, not historical contract wins.
What We’re Testing Over the Next 90 Days
The Fed200 is in active development. Week 4 validated some hypotheses and raised new questions. Here’s our testing roadmap:
1. Does Tier 2 deliver better long-term returns?
Evidence: Tier 2 has doubled Tier 1’s 3-year returns (+107.3% vs +56.7%)
Testing: Is this persistent, or does it vary by market cycle? Do mid-tier contractors ($1B-$25B contract revenue) offer a better risk/return profile?
2. Contract frequency vs. contract size
Evidence: Grainger wins 1,600 actions worth $30M. HII wins 2 actions worth $1B.
Testing: Which pattern predicts better stock performance? High-frequency/low-value or low-frequency/high-value?
3. Portfolio construction
Question: Would a concentrated portfolio of 60-80 consistent performers beat the broad 207-stock basket?
Testing: Contract winners are concentrated. Does portfolio performance improve with selectivity?
My Personal Test & Disclosure
Last Thursday (January 29th), I opened a test portfolio. I’m holding seven stocks from the Fed200 - spread across Tier 1, Tier 2, and Tier 3. I’ll be adding to the portfolio over the year, and it’ll keep you up to date on what I’m seeing.
Performance reporting starts next week once I have a full trading week of data.
Why do this? Mainly to have a little skin in the game, stay motivated, and see if any of this really matters.
Note: This is a relatively low-dollar test definitely not investment advice.
What’s Next
Next week’s report (Week 5) will cover:
The weekly Fed200 performance
My portfolio’s first full week of performance
Which original tiers are delivering the best risk-adjusted returns
Contract volume vs. contract sensitivity (testing the thesis)
Tier 1 stability vs. Tier 2 growth (deeper analysis)
The Fed200 isn’t finished. It’s a living research project. And now it’s backed by actual capital.
The Fed200 Index is an analytical framework developed by GovClose that tracks government contract data and stock price correlations across 207 publicly traded federal contractors. Analysis conducted by Rick Howard, founder of GovClose and retired U.S. Air Force Lieutenant Colonel who managed over $82 billion in government contracts during his 20-year military career. After retiring from active duty in 2019, Rick founded GovClose, a government contracting education and certification company focused on helping professionals and businesses understand how federal markets actually work.
Data Sources: SAM.gov contract awards database for the 207 tracked companies, Yahoo Finance market data, publicly available SEC filings. Stock prices current as of January 30, 2026 market close. Contract data reflects awards through January 30, 2026 with typical 1-2 month reporting lag from award execution.
Views expressed represent the analysis of Rick Howard and the GovClose team and should not be construed as investment recommendations. Past performance does not guarantee future results. Contract data has inherent reporting delays. This analysis tracks patterns in government contract data and stock prices to test whether correlations exist over time.
Report Published: February 2, 2026 | Week 4 Edition
About GovClose
GovClose specializes exclusively in government contracting education and market intelligence:
Professional Development: Government contracting certification programs | Federal sales fundamentals training | Compliance and regulatory education | Business development strategy workshops
Market Intelligence: Weekly federal spending analysis (Federalytics newsletter) | Contract award tracking | Fed200 Index tracking reports | Agency procurement pattern research
Learn More: govclose.com | federalytics.substack.com | youtube.com/@dodcontractacademy | [email protected]
Ready to go pro?
The GovClose Professional Training Program is built for people ready to commit to learning a new skill set, implementing that skill set, and working with a community of professionals who are serious about winning in the federal market.
If you think you have what it takes, set up an enrollment interview with the GovClose advisory team.